Actevate · via eHealthier
Role-based dashboards for Actevate
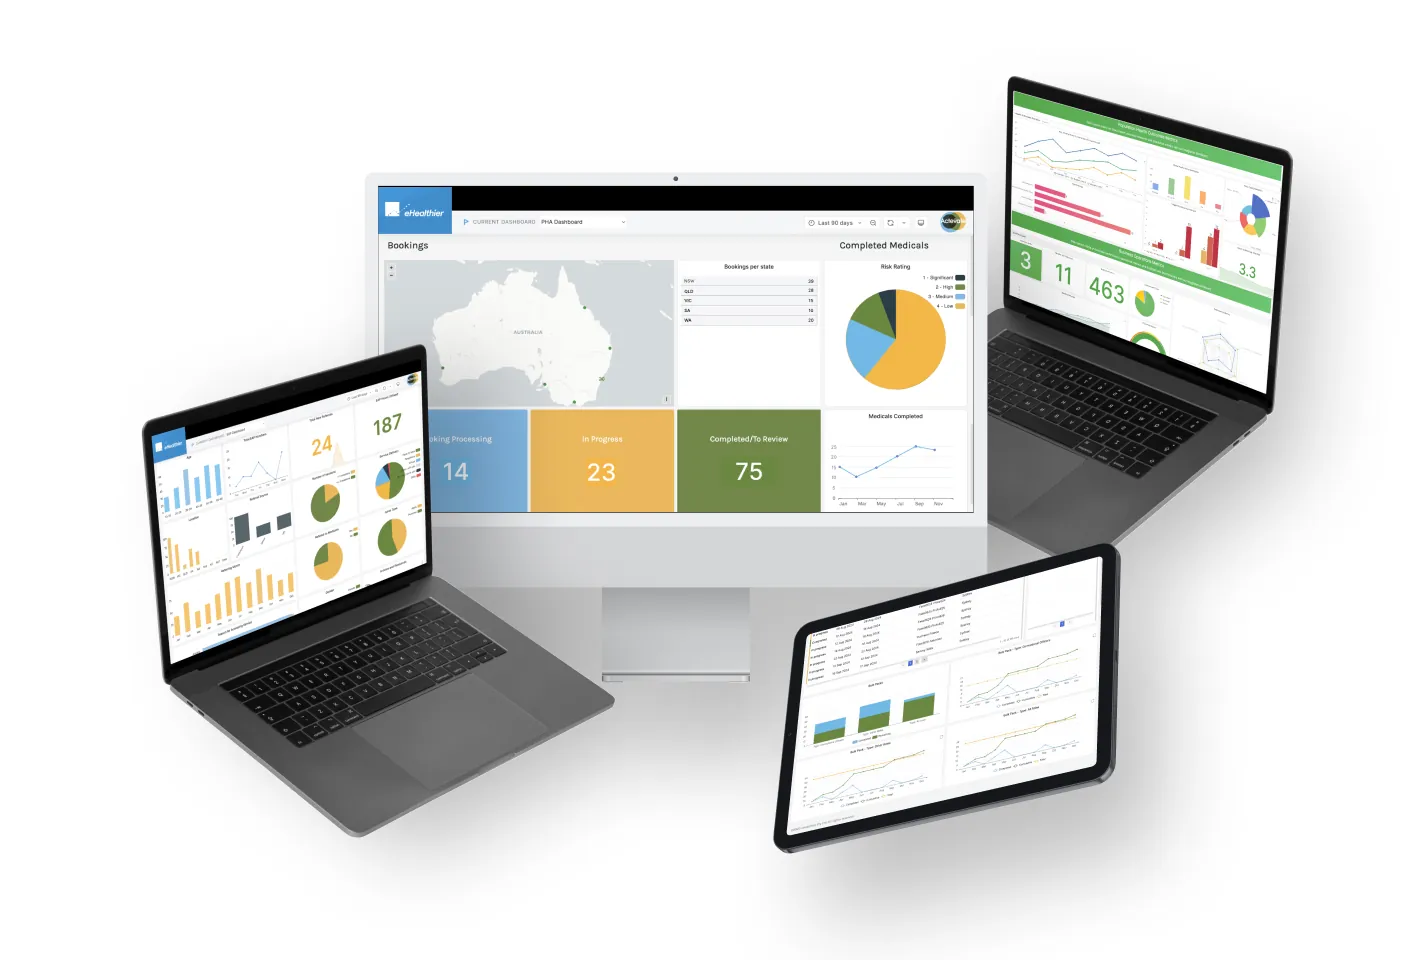
Actevate is a national workplace injury management provider. I designed one connected set of dashboards that rolls up from individual cases to client, regional, finance and executive views, so every role can see how patients and the business are doing at a glance.
- Outcome
- Dashboards from case to executive level, with colour-coded triage and one-click drill-down, that cleared the blockers to onboarding.
- Role
- UX Designer, Researcher & Client Contact
- Team
- eHealthier development, legal and a doctor consultant; at Actevate, physios, psychologists, management, finance and the director
- Timeline
- 3 months
- Methods
- On-site observation and interviews · co-design workshops · analytics review · competitor scan · wireframe validation
- Deliverables
- Role-by-role requirements · current vs future-state process · dashboard designs · export and scheduled-report design
- Skills
“I wish Ned had been involved earlier in the project so that our needs could have been understood from the very start.”
What I designed
- A case-to-executive ladder. One system that rolls up from individual cases to client, regional, finance and executive views, with role-based access so each team sees its own scope.
- Colour status cues for quick triage at every level.
- One-click drill-down from any summary to the detail behind it.
- PDF and CSV exports and scheduled email summaries, so teams stop rebuilding reports by hand.
- Cliniko and Xero integrations, so clinical and finance views run on live data.
- Standardised ePROMs for every patient, designed to support benchmarking provider performance (for example, return-to-work times) and identifying fraudulent claims.
The problem
Actevate needed visibility across every level of the business without stitching together manual reports. That made it hard to compare performance, surface risk, or make timely finance and management decisions.
Before
Fragmented and manual
- Providers handled all communication with patients independently.
- Care methods were unique to each provider, so hard to compare or track.
- Manual reports were created and passed up the chain.
- Finance relied on static reports to inform employer and insurer contracts.
- No unified view across patients, providers or performance.
After
Connected and insightful
- Every patient answers the same ePROMs, so results are consistent.
- Individual progress and aggregated population data in one place.
- ePROMs flag early signs of physical and mental health issues.
- Finance and management decide on live, collated data.
- Consistent data, designed to support provider benchmarking and identifying fraudulent claims.
The shift: from manual, provider-centric reporting to a preventative, data-driven system that benefits patients, employers, insurers and Actevate itself.
Research
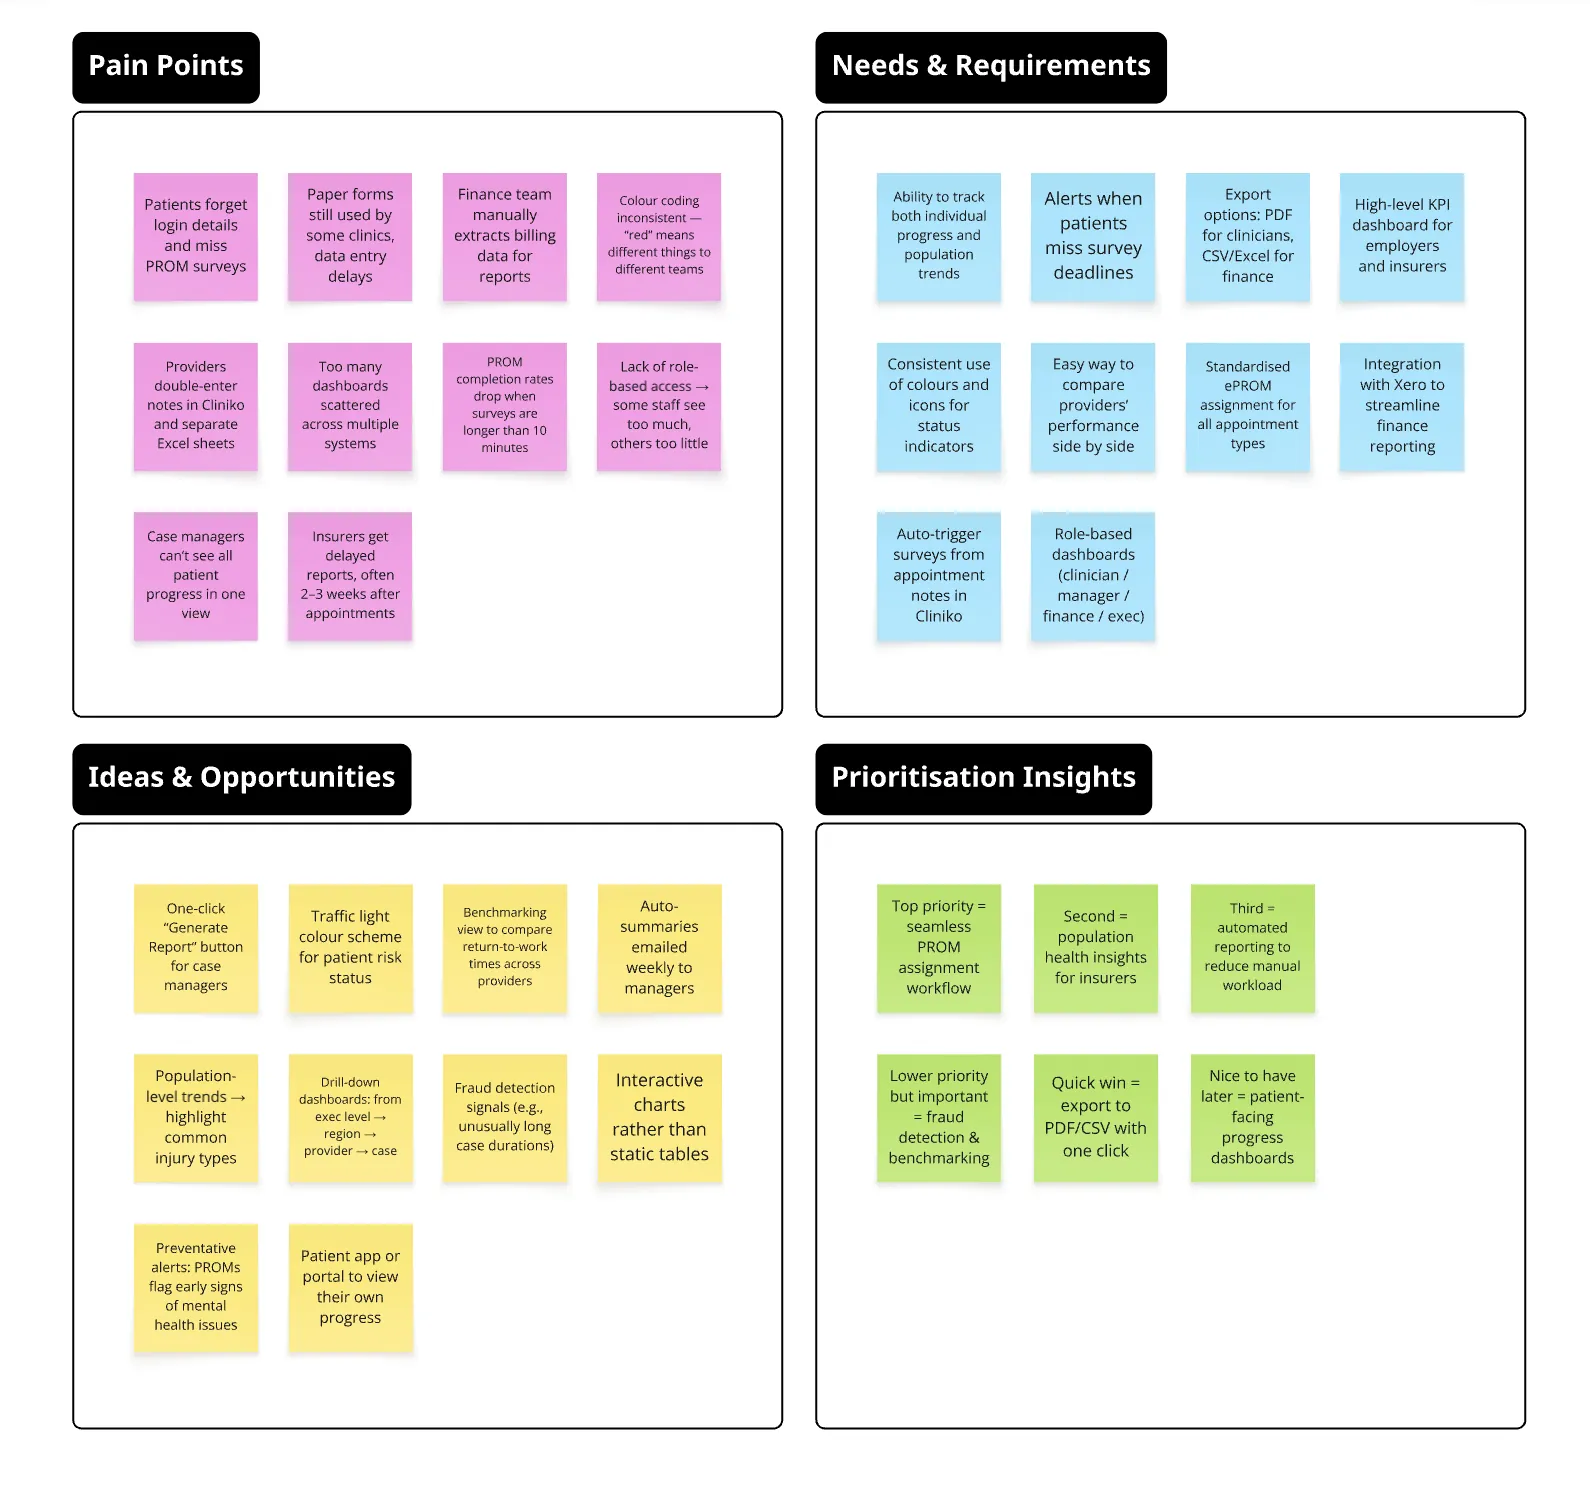
I spent a week on site at Actevate, observing operations and interviewing staff at every level from the CEO to claims officers. Co-design workshops, analytics reviews and competitor scans followed. Adoption hinged on three things:
- Consistent, automated ePROM assignment tied to appointment context.
- Clear, role-based dashboards that ladder up from cases to portfolios.
- Effortless extraction (PDF, CSV and scheduled reports), so teams could act without rebuilding data every week.
Analysis
Each level of the business needed its own view, built on the same data:
| Role | Decision they make | What their view shows |
|---|---|---|
| Case | Whether an individual patient is progressing, or showing early signs of a physical or mental-health issue | That patient’s ePROM results and progress, colour-coded by status |
| Client | How cases for one employer or insurer are tracking | That client’s cases, rolled up |
| Regional | Which providers and cases in a region need attention | The region’s cases and providers, compared |
| Finance | Employer and insurer contracts, based on live data instead of static reports | Collated case data alongside finance data from Xero |
| Executive | How the business is doing overall | Everything rolled up, with one-click drill-down to the detail |
Design
I mapped a journey for each role, sketched dashboard modules with Actevate’s teams, and tested low-fidelity wireframes for information hierarchy, colour status cues and drill-downs. Validation sessions confirmed the core need: a fast overview with one-click paths to the detail. I worked in Figma and on paper.
Working with engineering
I worked with eHealthier’s developers on the Cliniko (clinical) and Xero (finance) integrations, so each view runs on live data, and on role-based access and scopes so each team sees only what privacy rules allow.
Impact
- Cleared the blockers to onboarding; the next stage began after positive stakeholder reviews.
- Workshop participants reported clearer mental models of “how the business is doing”.
- Exports and scheduled summaries reduced manual reporting time.
Reflection
Design clarity came from aligning clinical, operational and financial perspectives, and from building the ladder on consistent inputs. Next time I would bring in a UI specialist earlier to refine the visual language across every level, and run a short in-situ pilot to harden the export and scheduling needs.