eHealthier
Whole Person Wellbeing Index (WPWI)
A composite score that brings physical, mental and social health together in one glanceable number, with drill-down panels showing how each health domain drove it.
- Outcome
- An explainable wellbeing score with risk stratification for clinicians, used in investor and partner presentations.
- Role
- UX Designer, Researcher & Product Designer
- Team
- Doctor consultant, statistician and psychometrician, with national societies and international partners
- Timeline
- 6 months
- Methods
- Stakeholder interviews · workshops with doctors, insurers and patient groups · psychometric review · benchmarking against WHO frameworks · wireframe testing
- Deliverables
- Score presentation and drill-down design · patient and clinician dashboard views
- Skills
Explainable by design
A single score is only useful if people trust it. Patients and clinicians both wanted one glanceable number, but they also needed to see what was behind it.
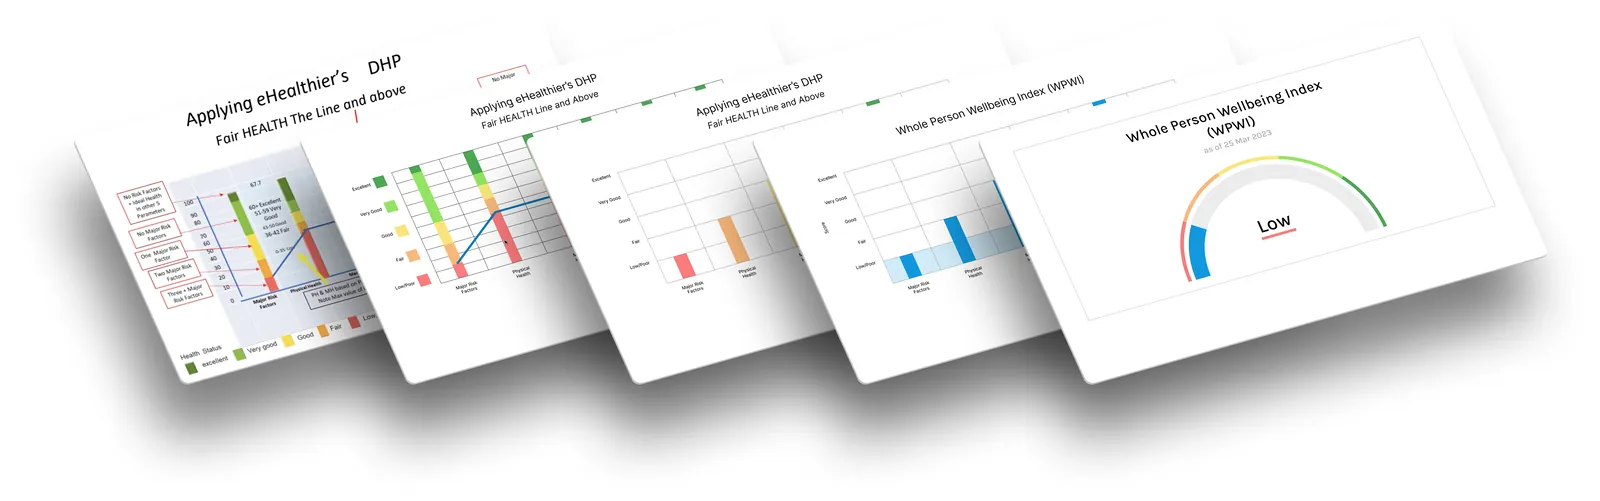
- Score first. The WPWI sits at the top of every view, colour-coded so it reads without clinical jargon.
- Drill-down. Each patient’s individual factors sit beneath the score in interactive panels that show how each wellbeing domain contributes to it.
- Risk stratification. The clinician view adds detailed analytics and stratifies patients by risk.
- Two views, one system. A simple, colour-coded patient view and a detailed clinician view share one dashboard system.
- Guidance, not diagnosis. We could not present the WPWI as a clinical diagnosis, so language and visuals frame results as supportive guidance, not medical advice.
Scores also roll up from individuals to whole populations, which the team called a “Gross Health Product”.
The problem
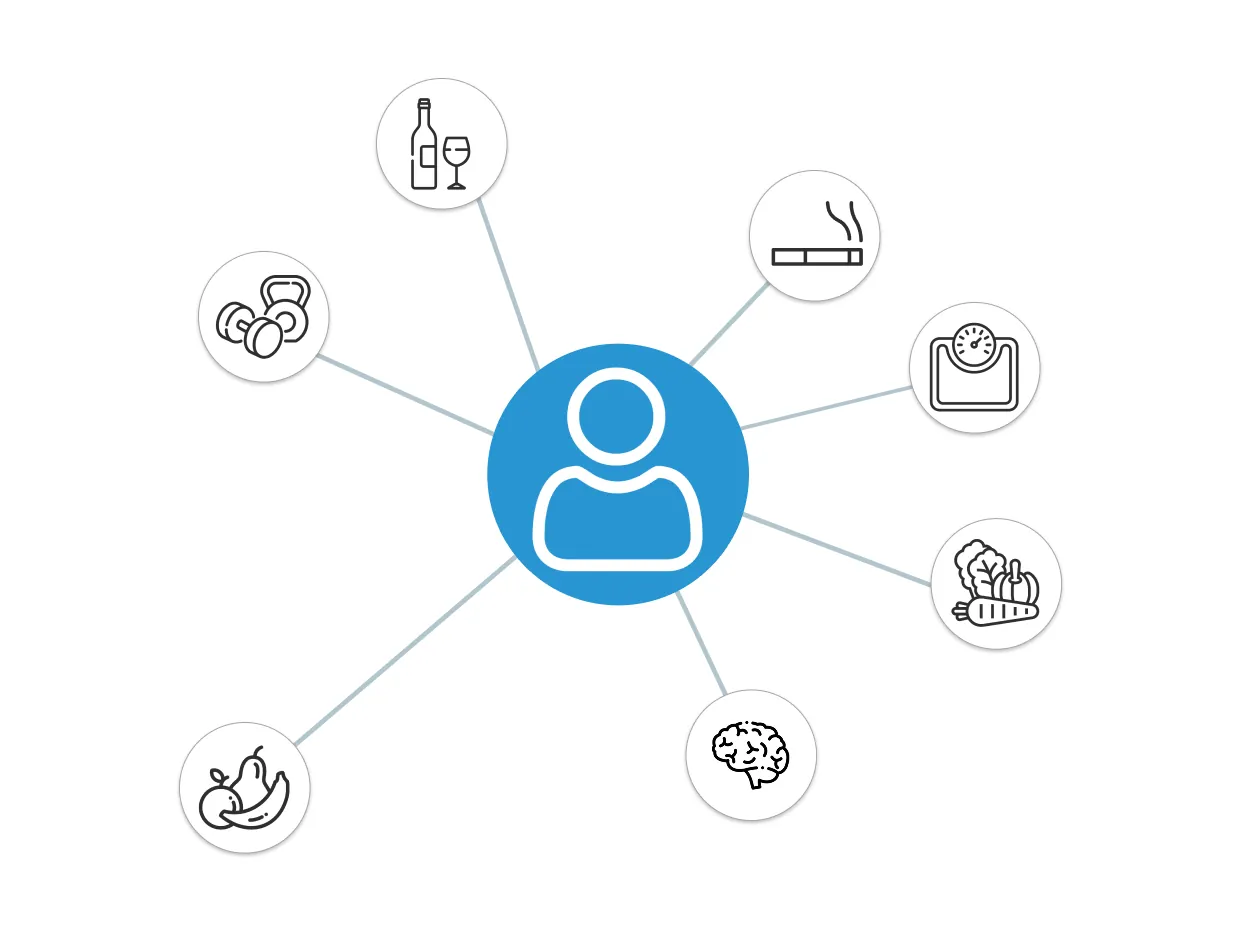
The WPWI was the brainchild of Dr Eddie Price, developed over decades of research. The challenge was turning a highly conceptual, multi-layered idea into a usable product: one index combining several dimensions of health, interpretable at every level from individual patients to governments.
Research
We combined eHealthier’s existing WPWI research with stakeholder interviews, workshops with doctors, insurers and patient groups, work with psychometric experts, and benchmarking against WHO frameworks. Three insights shaped the design:
-
Visualising complexity
Wellbeing is multidimensional. Users wanted a single, glanceable score, but also colour-coded visuals to unpack the nuance without overwhelming patients.
-
Patient accessibility
Patients preferred shorter, simpler surveys. Attention and completion dropped after 10 minutes.
-
Ethical and legal limits
Results had to read as supportive guidance, never as a diagnosis or medical advice.
Design
Low-fidelity wireframes tested with medical professionals and patient representatives confirmed the need for both a quick snapshot and deeper detail. Working in Figma and on paper, the design moved towards:
- colour coding that communicates wellbeing without clinical jargon
- a balance between data density and glanceable simplicity
- three short-form PROMs, to reduce fatigue and lift completion, scored by an algorithm into the WPWI
- one dashboard system that adapts for patients and clinicians.
Impact
- Used in investor and partner presentations.
- Gave stakeholders a visual language for complex health concepts.
“Finally, a way to see health in a single picture — this makes sense.”
“The design strikes the right balance between rigour and usability.”
Reflection
Designing for several audiences at once meant balancing ethics with usability and working closely with domain experts. Next time I would run larger user studies earlier, to validate the visualisations before stakeholder demos.